
- Why should use Power BI.?
Because , power bi provides an easy way for anyone ,including non technical people to connect change and visualize their raw business data from many different sources and turn it into valuable data that make it easy to make smart business decisions.
- What is power pivot?
This add in allows importing large amount of data from several sources into one workbook. users can analyze data without the need for IT assistance.
- What is Power BI?
- Power BI is a business analytics tool developed by Microsoft that helps you turn multiple unrelated data sources into valuable and interactive insights. These data may be in the form of an Excel spreadsheet or cloud-based/on-premises hybrid data warehouses. You can easily connect to all your data sources and share the insights with anyone.
- What is the measure in Power BI?
The measure perform calculations on aggregated values dynamically based on filters applied within reports, they are recalculated based on user intaractions with visuals.
What are Filters in Power BI?
The term “Filter” is self-explanatory. Filters are mathematical and logical conditions applied to data to filter out essential information in rows and columns. The following are the variety of filters available in Power BI:
- Manual filters
- Auto filters
- Include/Exclude filters
- Drill-down filters
- Cross Drill filters
- Drillthrough filters
- URL filters–transient
- Pass-Through filters
What is a dashboard in Power BI?
A dashboard is a single-layer presentation sheet of multiple visualizations reports. The main features of the Power BI dashboard are:
- It allows you to drill through the page, bookmarks, and selection pane and also lets you create various tiles and integrate URLs
- A dashboard can also help you set report layout to mobile view.
What are the different types of relationship in power bi ?
One -to-one(1:1) – Each record in one table corresponds toone record in another table.
One-to-many(1:N) – One record from one table relates to multiple records in another table.
Many-to-many(N:N) – Records from tables can relate to multiple records from each other.Rows in one table can relate to multiple rows in another table and vise versa.
Dashboards
A Power BI dashboard helps you to share a single visualization with colleagues and clients to view your final dashboard.
Tiles
A tile is an individual visualization on your final dashboard or one of your charts in your final report.
- What are the different types of visuals used in Power BI ?
- 1) Bar Chart
- 2) Pie Chart
- 3) Stacked Bar Chart
- 4) Line Chart
- 5) Area Chart
- 6) Column charts
- 7) Combo charts
- 8) Doughnut charts
- 9) Funnel charts
- 10) Cards and Funnel
- 11) Scatter Chart
- 12) Ribbon Chart
What is Power BI Desktop ?
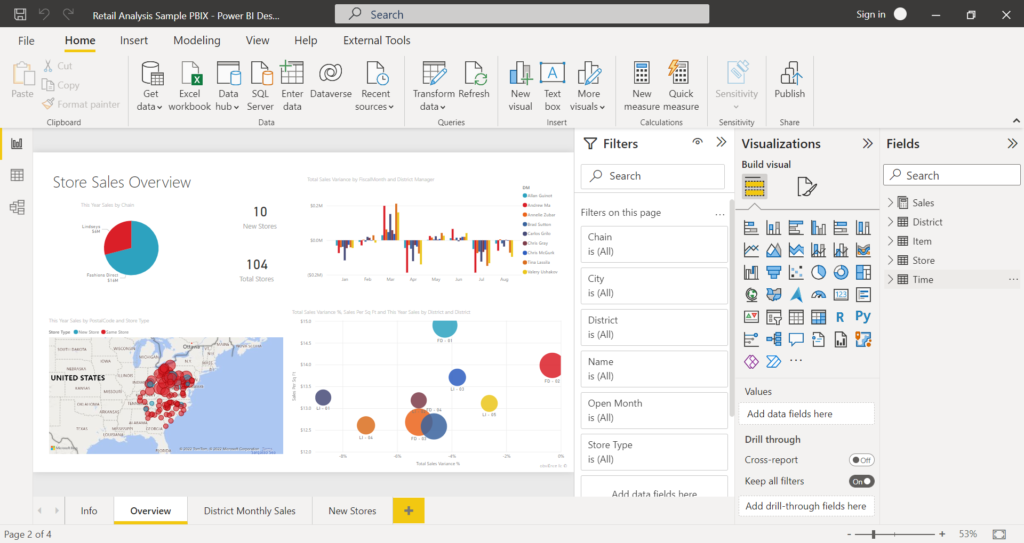
Power BI Desktop is a free application you install on your local computer that lets you connect to, transform, and visualize your data. With Power BI Desktop, you can connect to multiple different sources of data, and combine them (often called modeling) into a data model.
The most common uses for Power BI Desktop are as follows:
- Connect to data.
- Transform and clean data to create a data model.
- Create visuals, such as charts or graphs that provide visual representations of the data.
- Create reports that are collections of visuals on one or more report pages.
- Share reports with others by using the Power BI service.
Business Intelligence Tool :- BI Toll are the types of Application Software that collect and process large amounts of unstuctured data from internal and external systems, including books, journals, documents, health records, images, files, email, video and other business sources.
What is Power Query ?
Power Query is a data connection technology used in Power BI for transforming, cleaning, and shaping data before it is loaded into the data model.
What do you understand of Business Intelligence?
Business Intelligence , is a technology for collecting, analyzing and delivering business data to support decision-making in organizations This system uses a variety of tools, applications and practices to transform raw data organize them into valuable insights. By doing so, companies can make informed decisions, spot trends and improve their overall performance.
Explain the building blocks of Microsoft Power BI?
1. Visualizations
Visualization is the process of generating charts and graphs for the representation of insights on business data.
2. Datasets
A dataset is the collection of data used to create a visualization, such as a column of sales figures. Dataset can get combined and filtered from a variety of sources via built-in data plugins.
3. Reports
The final stage is the report stage. Here, there is a group of visualizations on one or more pages. For example, charts and maps are combined to make a final report.
4. Dashboards
A Power BI dashboard helps you to share a single visualization with colleagues and clients to view your final dashboard.
5. Tiles
A tile is an individual visualization on your final dashboard or one of your charts in your final report.

What is difference between Power BI Desktop and Power BI Service?
Power BI Desktop:-
Power BI Desktop is a comprehensive data analysis and reports creation tool that you can download and install on your work computer for free. With Power BI desktop you can transform, connect, visualize as well as analyze your data on your system. The Query Editor, which is a part of the Power BI Desktop, assists you to connect several different sources of data and combine these data into a single data model and design a report based on that data model. Additionally, these reports can be published directly to the Power BI service or can be shared easily with others.
Common uses for Power BI Desktop are as follows:
Connect to dataCreate a data model, by transforming and cleaning that data.Provide a visual representation of the data by creating visuals like – graphs and charts.Create reports that are a compilation of visuals, on one or more report pages.
Transform, Clean create a Data Model
Power BI Desktop, enables you to transform and clean data using the built-in Power Query Editor. This Power Query Editor, allows you to execute changes to your data, like, changing a data type, removing columns, or even combining data from various sources
What is Power BI Service?
The Power BI service also referred to as Power BI Online, is a SaaS (Software as a service) and is a collection of software services, applications, and connectors that operate together to support you in creating, sharing, and consuming business data in the way that helps both you and your business most efficiently. This cloud-based Power BI service helps teams and businesses with collaboration and report editing and allows you to connect to data sources, however, data modeling is limited.
The Power Bi service enables you to access dashboards to help you retain a finger on the pulse of your business. Dashboards showcase tiles, which you can select to open reports for exploring further. Dashboards and reports connect to datasets that bring all of the relevant data together in one place. You can perform tasks such as creating and sharing apps, creating dashboards, as well as exploring and analyzing data to uncover business insights.
Collaborating
Workspace in the Power BI service is where you collaborate and develop dashboards that compile your reports and share them within your team or organization. While viewers have only a reading view, and cannot edit reports, you can share your datasets and let others create their reports from them if you choose to do so.
Power BI report designers working on business intelligence plans often use BI Desktop to develop reports and utilize BI service to collaborate and share these reports.
What is the difference between Dashboard And A Report in Power BI ?
Dashboards, in the context of Power BI, are visual displays that provide a consolidated view of data. They allow users to monitor key metrics, track performance, and gain high-level insights at a glance.
In general, dashboards are designed to display data in real-time or near-real-time. They can connect to various data sources, including databases, cloud services, and streaming data, providing up-to-date information.
While different visualizations can be used in dashboards, they focus mainly on charts, graphs, gauges, and cards. These visual elements represent key performance indicators (KPIs) and provide a quick overview of business metrics. Therefore, dashboards are typically limited to a single page, allowing users to see multiple visualizations at once. This simplicity helps users quickly grasp the overall performance of their business.
Reports
are comprehensive and detailed pages that provide in-depth analysis and insights. They offer more advanced functionalities compared to dashboards.
Reports enable users to dive deep into data, perform ad-hoc analysis, and explore multiple dimensions. They provide a comprehensive view of data, allowing users to answer complex business questions. This is made possible by offering interactive features such as drill-through, filtering, and highlighting. Users can explore data further by interacting with the visualizations, uncovering deeper insights.
Since so many visuals and other elements are incorporated into reports, it is best to split them across multiple pages or tabs, each containing different visualizations, tables, and interactive elements. Users can navigate between pages to explore specific aspects of the data, by using buttons and bookmarks.
What is DAX and why is important in Power BI ?
What is DAX?
Data Analysis Expressions, or DAX for short, are expressions and formulas for analyzing and calculating data. Expressions like this are made up of various parts, such as functions, operators, and constants, all combined into a single formula and evaluated to provide a result (value or values). Power BI and other BI tools make excellent use of the data at their disposal, and the DAX formulae they contain are a big reason.
DAX is a collection of functions, operators, and constants that can be used in a formula, or expression, to calculate and return one or more values. DAX helps you create new information from data already in your model.
Why is DAX so important?
It’s easy to create a new Power BI Desktop file and import some data into it. You can even create reports that show valuable insights without using any DAX formulas at all. But, what if you need to analyze growth percentage across product categories and for different date ranges? Or, you need to calculate year-over-year growth compared to market trends? DAX formulas provide this capability and many other important capabilities as well. Learning how to create effective DAX formulas will help you get the most out of your data. When you get the information you need, you can begin to solve real business problems that affect your bottom line.
What is the purpose of Power Query editor ?
Power Query Editor is a crucial component of Power BI, a business analytics tool by Microsoft. Its purpose is to transform and shape data from various sources into a format that is suitable for analysis and visualization within Power BI. The primary objectives and purposes of Power Query Editor in Power BI include:
1. **Data Transformation and Cleaning:**
Power Query Editor allows users to clean and transform raw, unstructured, or messy data into a clean, structured format. This includes removing duplicates, handling missing values, changing data types, and applying formatting.
2. **Data Integration and Combining:**
Users can integrate data from multiple sources by merging or appending tables, facilitating comprehensive analysis across diverse data sets.
3. **Data Consolidation and Aggregation:**
Power Query enables the consolidation of data from different sources into a single, cohesive dataset, providing a unified view for analysis. It allows for aggregation and summarization of data to various levels of granularity.
4. **Data Splitting and Parsing:**
Data can be split into separate columns or rows based on specific delimiters, patterns, or rules, enabling efficient parsing of complex data structures.
5. **Data Enrichment:**
Power Query Editor allows users to augment or enrich the data by combining it with additional information from other sources, enriching its context and usefulness for analysis.
6. **Handling Unstructured Data:**
Power Query can parse and process unstructured or semi-structured data formats like JSON, XML, and HTML, making it structured and ready for analysis.
7. **Query Reusability and Automation:**
Users can create reusable queries, which can be easily applied to new datasets with similar structures. This supports automation and streamlines the data preparation process.
8. **Custom Calculations and Conditional Logic:**
Users can apply custom calculations and implement conditional logic to transform the data as needed for analysis, providing flexibility in shaping the data based on specific requirements.
9. **Data Profiling and Quality Assessment:**
Power Query Editor offers data profiling capabilities that help in understanding the quality, completeness, and structure of the data, aiding in data quality assessment and improvements.
10. **Performance Optimization:**
Users can optimize data loading and transformation processes to improve performance by removing unnecessary columns, reducing data volumes, and applying efficient transformation steps.
11. **Data Connectivity and Source Settings:**
Power Query Editor facilitates connecting to a wide range of data sources, configuring connection settings, and managing credentials for secure access to data.
In summary, Power Query Editor in Power BI is a powerful and versatile tool that enables users to shape, clean, and transform data from various sources, making it suitable for analysis and visualization, ultimately enhancing the effectiveness and accuracy of business decision-making.